
A plain-language walk through every step of a pay equity audit — what happens, why it happens, and what the math really tells us — told through the story of one small ice cream company.
What Is a Pay Equity Audit?
A pay equity audit examines how employees are paid and whether differences warrant further review. It combines reliable data, appropriate employee comparisons and investigation of pay-setting decisions. The applicable law determines which comparisons and explanations matter. An audit can identify potential problems; it does not by itself certify that pay is fair or lawful.
To see how it works, let’s follow a made-up company called Sunny Scoops, an ice cream company with scoopers, shift leaders, and store managers.
The Seven Steps at a Glance
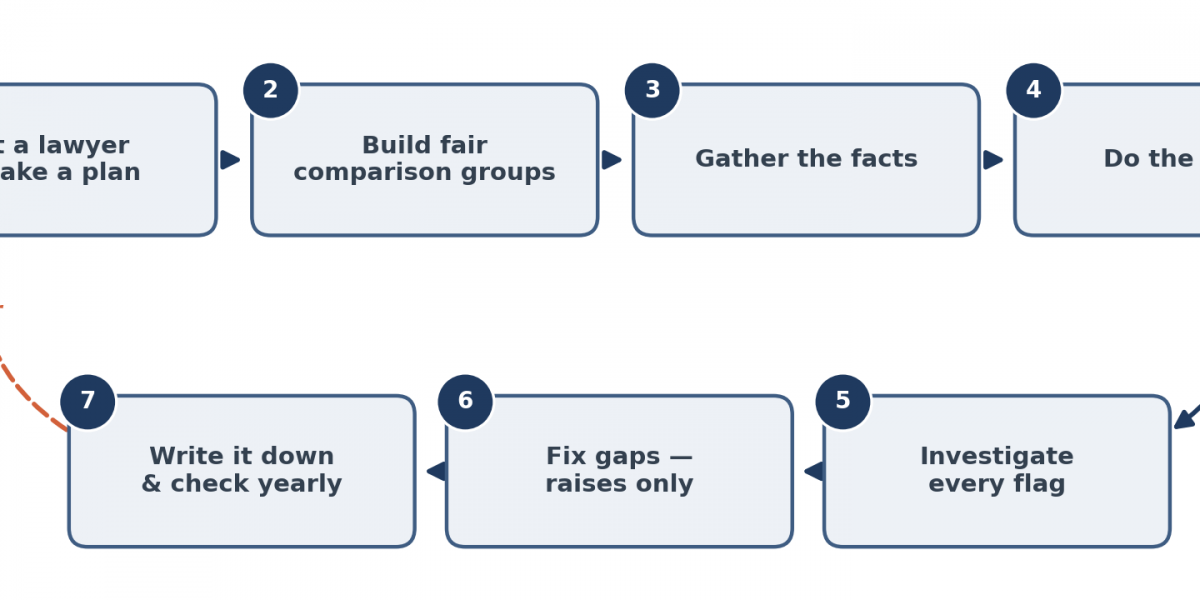
The review can be organized into seven stages. The sections below explain each stage and its limitations; the appropriate scope and schedule depend on the matter.
A review typically involves planning with counsel, appropriate comparisons, data validation, analysis, investigation, corrective action and follow-up. The timing and remedies depend on the circumstances and applicable law.
Step 1: Get a Lawyer’s Help and Make a Plan
Before looking at any numbers, Sunny Scoops asks a lawyer to help plan the review and advise on legal obligations. Attorney-client privilege may protect confidential communications made to seek or provide legal advice, but involving a lawyer does not automatically protect an audit, its drafts, or the underlying pay data. Protection depends on the facts, the purpose of the work, applicable law, and how information is handled and shared. Counsel should assess any privilege or work-product protection and manage the review accordingly.
With the lawyer’s help, the company also makes a plan. It decides which kinds of pay to check (like regular pay and bonuses), which workers to include, and what date to use for the numbers, like taking one clear photo of everyone’s pay on the same day.
Step 2: Compare Apples to Apples
Next, the company and counsel identify appropriate comparisons using actual work and the governing law. Job titles alone are not enough: differently titled jobs can sometimes be comparable, and a single title can cover materially different work. For this simplified story, Sunny Scoops initially reviews scoopers, shift leaders and managers, then checks whether those groups fit the actual duties and applicable standard.
Making good groups takes care. If a group is too big and mixed up, real problems can hide inside it, like trying to find one wrong answer in a giant messy pile of papers. If a group is too small, just two or three people, the math in the next steps won’t work well. Very small groups get checked one person at a time instead.
Step 3: Gather the Facts
Now the company collects accurate pay, job and employment information, including tenure, experience, training and location. These are potential explanatory factors, not automatically lawful reasons for a difference. Review whether each factor is job-related, consistently applied and permitted by the governing law, and whether it carries forward earlier discrimination.
The facts must be correct, so the team double-checks everything, just like checking your homework before turning it in. One warning here: some facts can secretly carry old unfairness inside them. For example, if the company sets pay based on what a worker earned at their last job, and that old pay was unfair, the unfairness sneaks in the door. The team must watch out for tricky facts like that.
Step 4: Do the Math
The team may use regression to estimate pay relationships while accounting for selected factors. It asks whether an estimated difference associated with a protected characteristic remains under that model. The answer depends on the data, employee groups, model and controls. A statistical association alone does not establish discrimination, and an absence of statistical significance does not establish fairness.
In this fictional example, Maya and Jake both scoop ice cream and have the same tenure, but earn $15 and $17 per hour. Those facts warrant a closer look at actual duties, qualifications and pay-setting records. They do not establish that every legally relevant factor is identical. Individual comparisons can matter even when a group statistical test is not suitable.
The Math Toolbox: A Closer Look
This toolbox introduces averages, spread, t-tests, p-values and regression. These tools describe differences and uncertainty under specified assumptions. They do not sort observed gaps into those caused by chance and those caused by discrimination. Use their results alongside job, pay-setting and individual evidence.
Averages and Spread
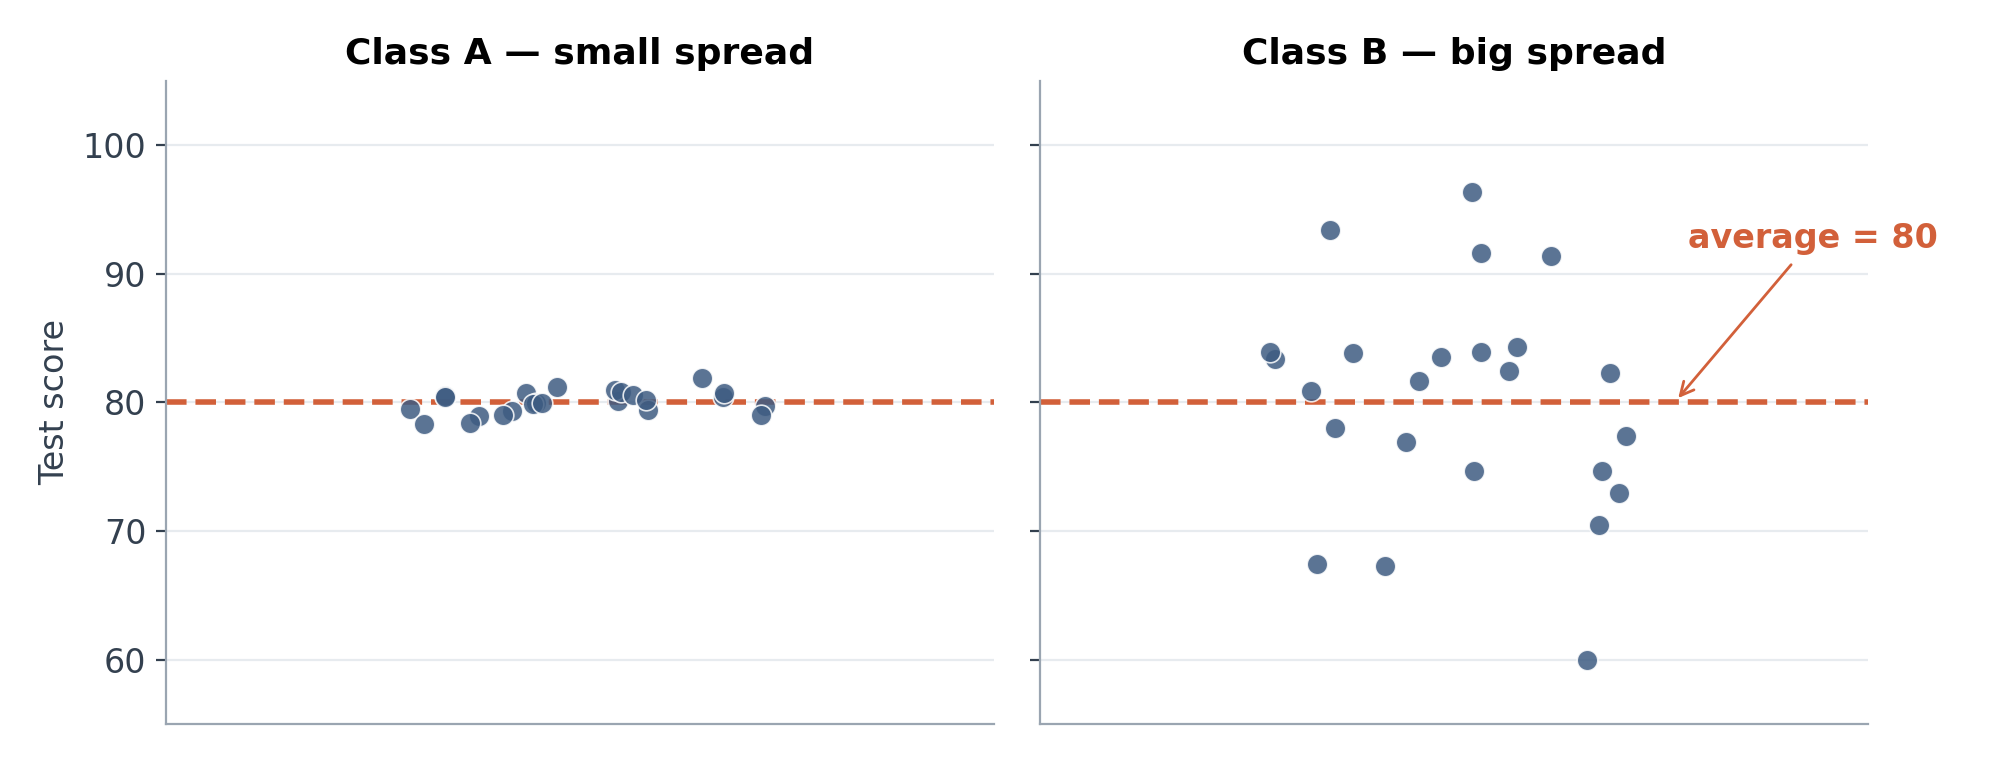
An average is the sum of the values divided by their number. Standard deviation describes how spread out individual values are around that average. Two groups can have the same average but different spreads. Greater spread can make a difference in averages harder to estimate precisely; it does not make the observed difference unimportant. A standard error measures uncertainty in an estimate and is different from the standard deviation of individual pay.
The t-Test: Comparing Averages and Uncertainty
A t-test compares an estimated difference with its standard error under a specified model. For the same two-sided test and degrees of freedom, a larger absolute t-statistic indicates greater incompatibility with the null hypothesis, assuming the model is appropriate. The threshold depends on the test, degrees of freedom and chosen significance level. A t-statistic near 2 is only an approximate reference, not a universal legal threshold.
In this illustrative independent-samples calculation, each group has 20 people. Average pay is $16 versus $15 per hour. If both groups have a sample standard deviation of $1.50, an equal-variance t-test gives t ≈ 2.11 with 38 degrees of freedom and a two-sided p-value ≈ 0.042. If both standard deviations are $4, the same calculation gives t ≈ 0.79. The observed dollar difference remains the same; the estimated uncertainty changes. Neither result determines whether the pay practices are lawful.
In the hypothetical example, the observed dollar difference stays the same while estimated uncertainty changes. An absolute t-statistic below its selected critical value does not make the difference disappear or establish compliance.
The p-Value: What the Model Predicts
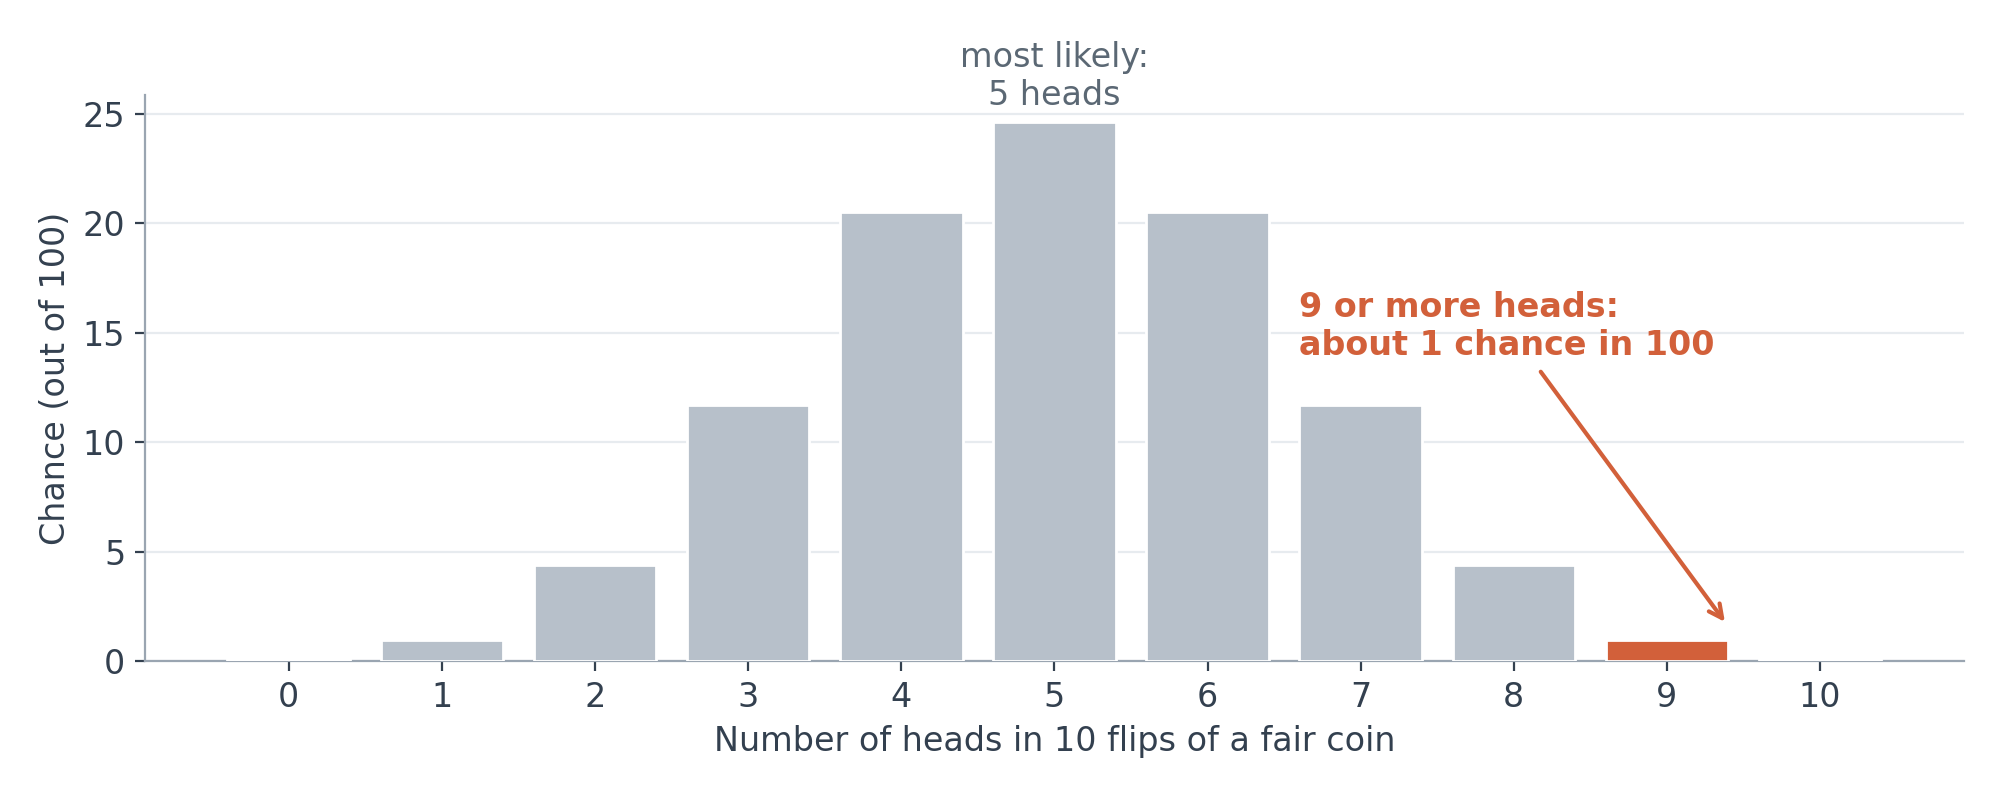
A p-value is the probability, under a specified null hypothesis and statistical model, of a result at least as extreme as the observed result. It is not the probability that chance caused the result or that the null hypothesis is true. For ten independent flips of a fair coin, the probability of nine or more heads is 11/1,024, about 1.1%. That is a one-sided tail probability. Counting either nine or more heads or nine or more tails gives about 2.1%, illustrating why the choice of test matters.
For the t-test example, p ≈ 0.042 means that, under the specified no-difference model and its assumptions, about 4.2% of repeated samples would produce an absolute t-statistic at least this large. It does not mean there is a 4.2% chance the gap is innocent, or a 95.8% chance discrimination occurred. Investigate the model and the underlying pay decisions.
Statistical Significance Is a Review Tool, Not a Verdict
A 0.05 significance level is a common analytical convention, not a universal legal test. Its corresponding t cutoff depends on degrees of freedom and whether the test is one- or two-sided; it is not always exactly 2. The statistic divides an estimate by its standard error, not by the spread of individual workers’ pay. Evaluate magnitude, uncertainty, assumptions, testing choices and other evidence together. A small p-value does not prove discrimination, and a larger one does not prove that pay is fair.
The reference distribution and significance cutoff depend on the test and its assumptions. The center of a distribution is not an “ordinary luck” finding about a particular pay gap.
Regression: Adjustment Under a Specified Model
A simple comparison of averages does not account for differences in employee or job characteristics. Regression can account for selected factors, such as relevant experience, when supported by the data and applicable law. It estimates relationships rather than deciding which reasons are fair. Controls can be omitted, measured poorly or themselves influenced by discrimination; adding more variables does not automatically improve a legal analysis.
Suppose an illustrative model leaves a 30-cent estimated gap with p = 0.35. That result is not statistically significant at 0.05, but it does not show that luck explains the gap or that the employer complies with the law. An 80-cent estimate with p = 0.02 would be statistically significant under the specified model, but would not prove discrimination or rule out unmeasured explanations. Both results require contextual review.
The regression examples are hypothetical. A small or nonsignificant adjusted estimate does not prove that experience lawfully explains the observed differences.
What the Math Can and Can’t Tell Us
Statistical analysis identifies patterns under specified assumptions. It does not establish causation, make every available factor lawful or rule out individual discrimination. Review effect size and uncertainty alongside actual work, pay-setting records, data limitations and model choices. Small groups and unmeasured factors require particular care.
Step 5: Look Closer at Every Flag
A flag is a question, not a conclusion. The team reviews actual work, pay decisions and contemporaneous records. A certificate may explain some pay difference only if it is a relevant, lawful and consistently applied factor that meets the applicable legal test. Merely finding a certificate does not automatically clear a flag. Review unresolved gaps and investigate individual concerns even where a group result is not statistically significant.
Step 6: Fix It the Right Way
When a review identifies an unlawful pay gap, do not lower another employee’s pay to cure it. Counsel should assess prospective adjustments, any back-pay liability and other required relief. In this fictional story, Sunny Scoops raises Maya’s pay; a raise alone does not establish that every remedial obligation has been satisfied.
Good companies also fix the habits that caused the problem in the first place. That might mean making clear rules for starting pay, so managers don’t just guess, and checking every raise and promotion for fairness before it happens. Fixing the leak matters as much as mopping the floor.
Step 7: Document the Work and Plan Follow-up
The team documents its data, comparisons, methods, findings and follow-up steps, with counsel advising on retention and disclosure obligations. It schedules future reviews appropriate to the workforce and applicable law, including after material changes. Annual review may be a useful practice, but this guide does not assert a universal annual-audit requirement.
How the Story Ends at Sunny Scoops
In this fictional illustration, Sunny Scoops reviews 40 scoopers, 12 shift leaders and 5 managers. Small groups receive individual review rather than relying solely on significance tests. The simplified scooper example produces an observed $1 hourly difference and an equal-variance t-statistic of approximately 2.11, with a two-sided p-value of approximately 0.042. These numbers illustrate a method; they do not describe a real engagement.
In a separate hypothetical follow-up model, relevant experience accounts for part of the difference, leaving an estimated 60-cent gap with p = 0.03. That is a signal for review, not proof that chance is excluded. The team investigates the records, evaluates any proposed explanations under applicable law and consults counsel about appropriate remedies. In the story, several employees receive prospective raises. The example’s assumed cost is not evidence of typical remediation costs.
Sunny Scoops also reviews its starting-pay and promotion practices. A later model produces a smaller estimated gap. That is useful information to examine with the underlying records, not a certification of compliance or a guarantee that future problems will not occur.
The fictional follow-up model produces a smaller estimated gap after adjustments. That result does not establish that every individual concern or remedial obligation has been resolved.
Questions People Often Ask
How long does an audit take?
Timing depends on scope, workforce size, data quality, job-comparison work and the review required by counsel. Data collection and validation may take longer than the statistical calculations. Agree on a realistic schedule for the particular engagement.
Who gets to see the results?
Counsel should help determine who needs access to the review materials and what may need to be disclosed. Limiting circulation can help preserve confidentiality, but it does not guarantee attorney-client privilege or work-product protection. The applicable rules, the purpose of each communication or document, and any disclosures matter. Workers may receive information about pay changes and revised practices; legal disclosure obligations must also be considered.
What if the audit finds nothing wrong?
An audit with no identified issue documents the work performed and its findings within the review’s scope. It is not written proof that all pay practices are lawful. Data gaps, model choices, small samples and individual claims can remain important. Any statutory defense requires its own conditions to be met, and future reviews may still be appropriate.
Why would a company check on itself?
A review can help an organization understand its pay practices, investigate concerns and consider corrections. Transparency requirements may make pay questions more visible. Costs and outcomes depend on the circumstances; the review does not guarantee lower litigation costs or improved retention.
How much do the fixes usually cost?
Remediation costs vary with the workforce, findings, legal obligations and adjustments considered. Estimate them from the organization’s own data rather than assuming a standard percentage of payroll. A fictional example is not evidence of typical costs or future savings.
Can the math ever be wrong?
Statistical tests can produce false positives and false negatives. A valid test at the 5% level controls its long-run false-positive rate at approximately 5% or less when the null hypothesis is true and the test assumptions hold. That does not mean 5% of this audit’s flags are false. Many tests, selected analyses, model errors and limited sample size can change interpretation. Review multiple-testing issues and examine individual evidence as well.
Why It All Matters
A careful review can help an organization understand pay decisions and respond to concerns. Its value depends on reliable work, appropriate legal guidance and meaningful follow-through, not a promise that the analysis proves fairness or guarantees employee retention.
Words to Know
Pay equity audit — A review of pay practices, appropriate comparisons and potential disparities. It is not a certification of compliance.
Privilege — A legal protection that may apply to certain confidential communications seeking or providing legal advice. It does not automatically cover a pay equity audit or its underlying facts merely because a lawyer is involved. Counsel should assess the applicable rules and circumstances.
Comparator group — Employees selected for comparison using actual work and the applicable legal and analytical standards, not titles alone.
Potential explanatory factors — Job and employee characteristics proposed to explain pay differences; each must be evaluated for accuracy, relevance and legal permissibility.
Average — Everyone’s pay added up and divided by the number of people.
Spread — How far people’s numbers usually sit from the average. Measured with a number called the standard deviation.
t-test — A statistical comparison of an estimated difference with its uncertainty under a specified model.
t-statistic — The estimated difference from a hypothesized value divided by its standard error. For a two-sided test, interpretation uses its absolute value, the degrees of freedom and model assumptions.
p-value — The probability, under a specified null hypothesis and model, of a result at least as extreme as the observed one. It is not the probability that chance caused the gap.
Statistically significant — A result meeting a stated significance threshold under a specified test. It does not by itself prove discrimination or practical importance.
Regression — A model estimating relationships while accounting for selected variables. Its conclusions depend on data, assumptions and lawful, appropriate controls.
Flag — A group or person the math marks for a closer human look. A flag is a question, not an answer.
Remediation — Corrective action addressing identified problems, with counsel assessing prospective adjustments, past-pay liability and other obligations; do not lower another employee’s pay to cure an unlawful gap.
The printable guide is being updated. Please use the current online guide above.
Grahall provides pay equity statistical analysis and expert witness testimony for counsel and companies nationwide. Learn more about our pay equity expert witness services or contact us to discuss a matter.
This material is general educational information, not legal or tax advice for a particular matter. Requirements vary by jurisdiction and can change. Counsel and tax advisers should verify the governing rules. No tax treatment, privilege, admissibility or case outcome is guaranteed. An inquiry does not create an engagement.
About the author: Ali Riyaz — Grahall Expert Witness Practice. Reasonable compensation and pay equity analysis, reports, and testimony. Meet the team or get in touch.